A Case of Deja Vu

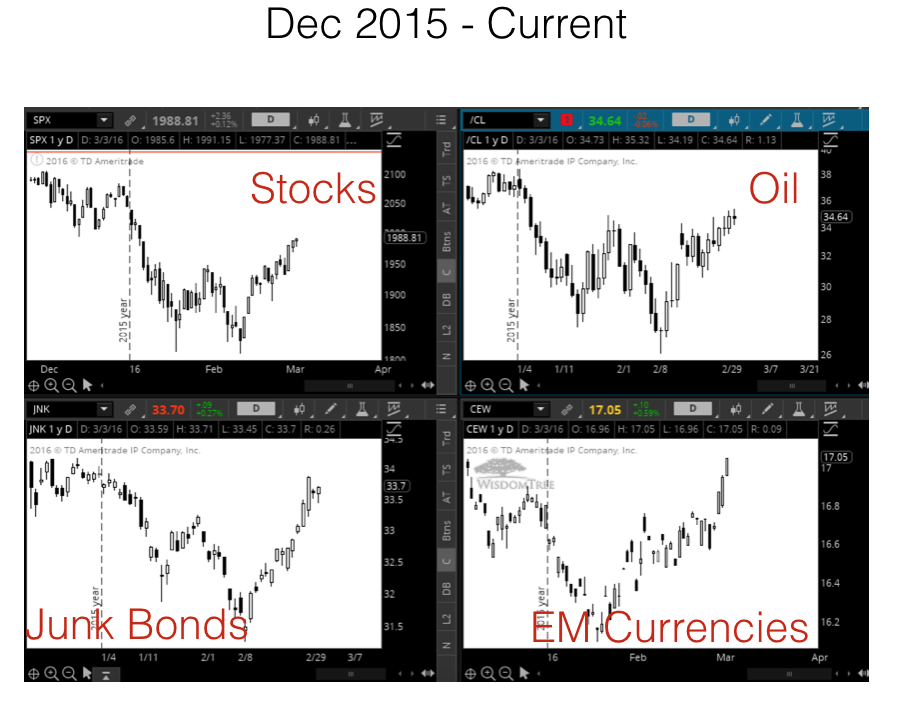
The move in the S&P 500 since January 1st (the selloff, bounce, weak test of the lows and a big surge afterwards) has been so eerily similar to the Aug-Oct move a few months back that it’s a little weird…  Even the multiple 2-day retracements in the middle of the surge. The August selloff unfolded after…

Chart of the Week: Tertiary Impact of Lower Oil Prices

There was an article in the Wall Street Journal this week discussing the approximately 5-fold rise of Sovereign Wealth Fund assets off the back of rising oil prices over the past decade.  Now that oil prices have fallen from over $100 per barrel to the mid-$30’s, most countries have begun tapping their funds to fill the…

Welcome to a World of Deflation

Here’s a chart to illustrate what happens during deflationary economic pressures, as we’re seeing right now (click to see a larger image): In order from top to bottom: Long-term Treasury Bonds (orange), US dollar (black), Emerging Markets (brown), Euro (Green), Yen (blue), Energy/oil (purple) – last 9 months Too much debt, not enough demand (poor…

On the Lookout for Some Holiday Deals & New Year Trend Changes

The end of the year tends to bring some odd movements in the markets.  These can occur for a handful of reasons but most are driven by funds with short-term incentive policies and year-end bonuses.  Fortunately, their short-sighted foolishness can be our gain since we’re in the position of investing for the long-term. Many funds…